


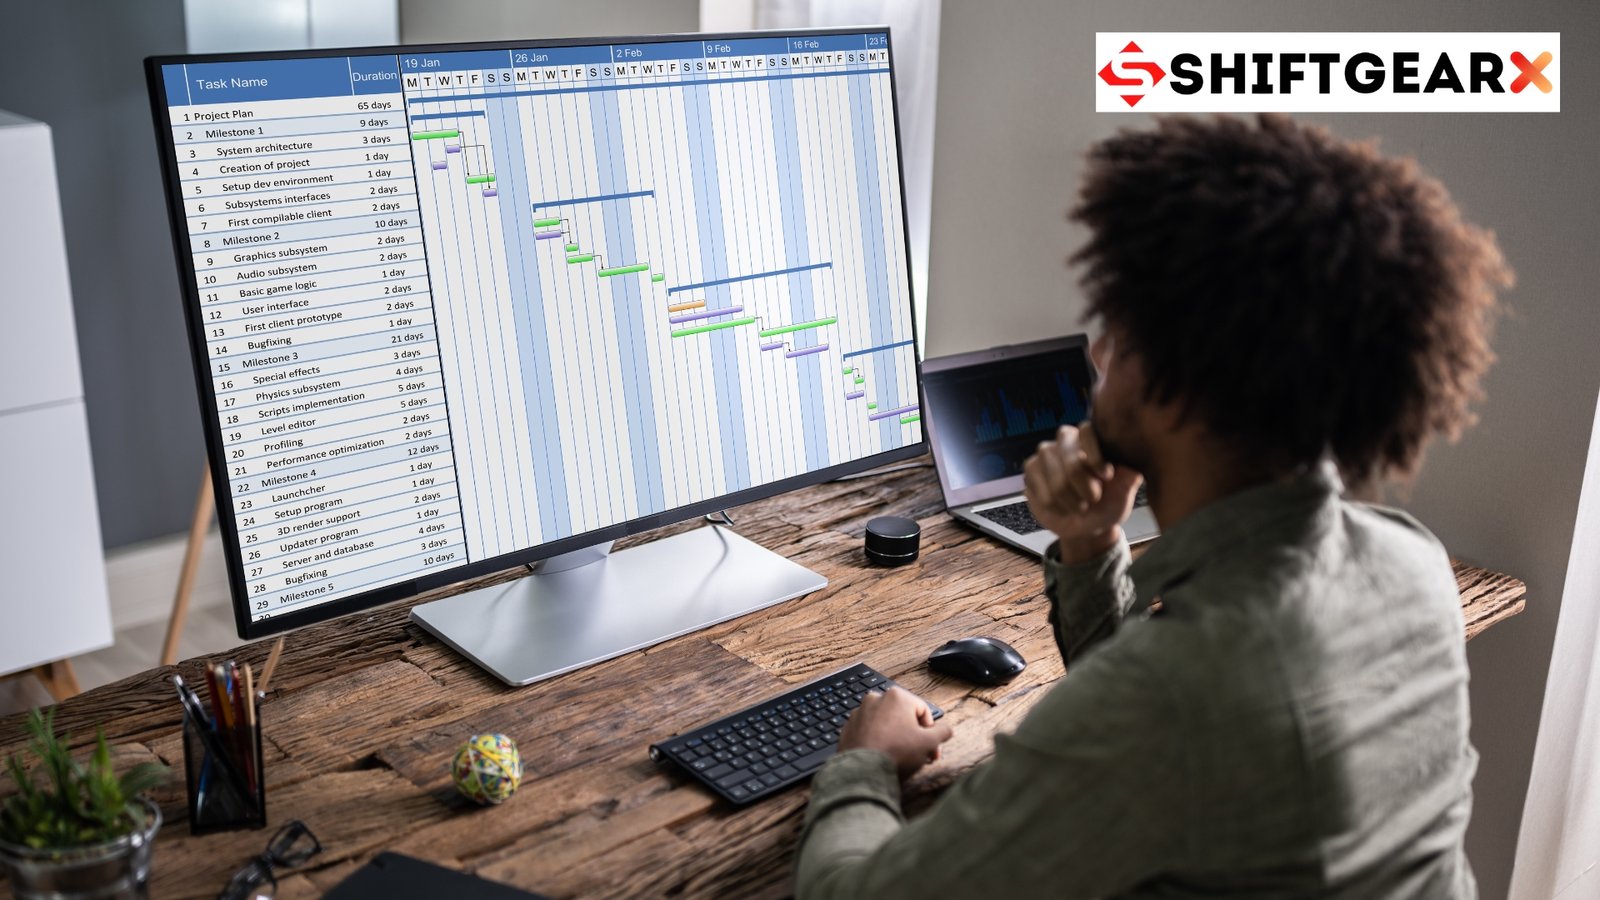
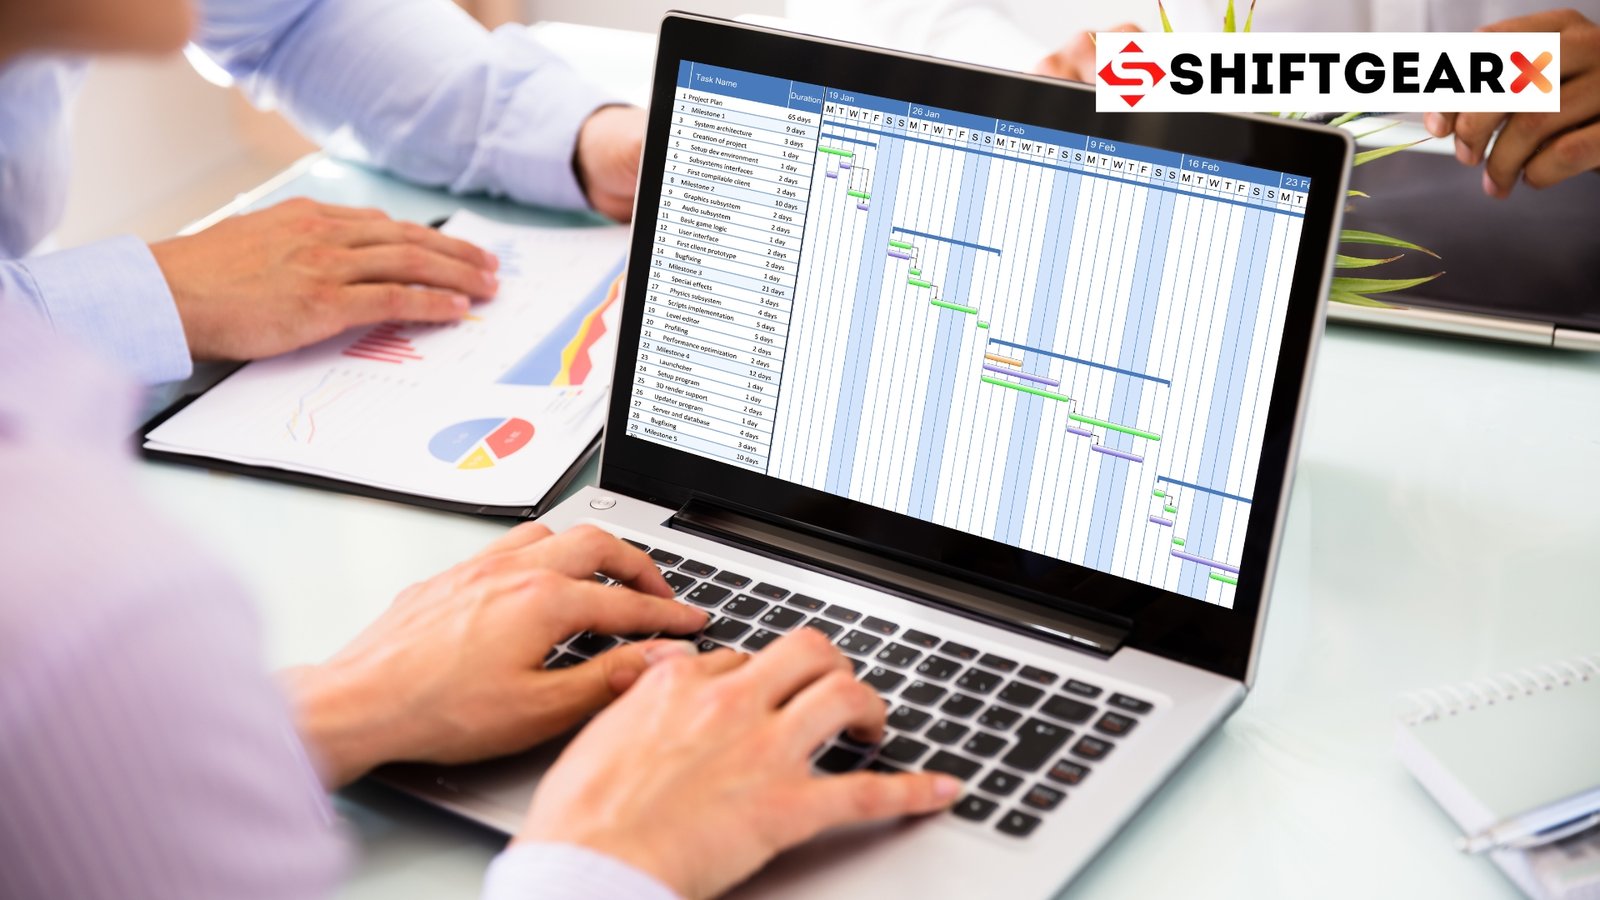
While focusing on Interactive and Dynamic Gantt charts, I remember the first time I encountered a Gantt chart. It was early in my career, and I was working on a small software development project. Our project manager proudly presented a colorful printout, covered in horizontal bars of various lengths. “This,” he announced, “is our project timeline.”
I nodded, pretending to understand. In reality, I was overwhelmed. The chart was dense, complicated, and, frankly, intimidating. How was I supposed to make sense of all those overlapping bars and dates?
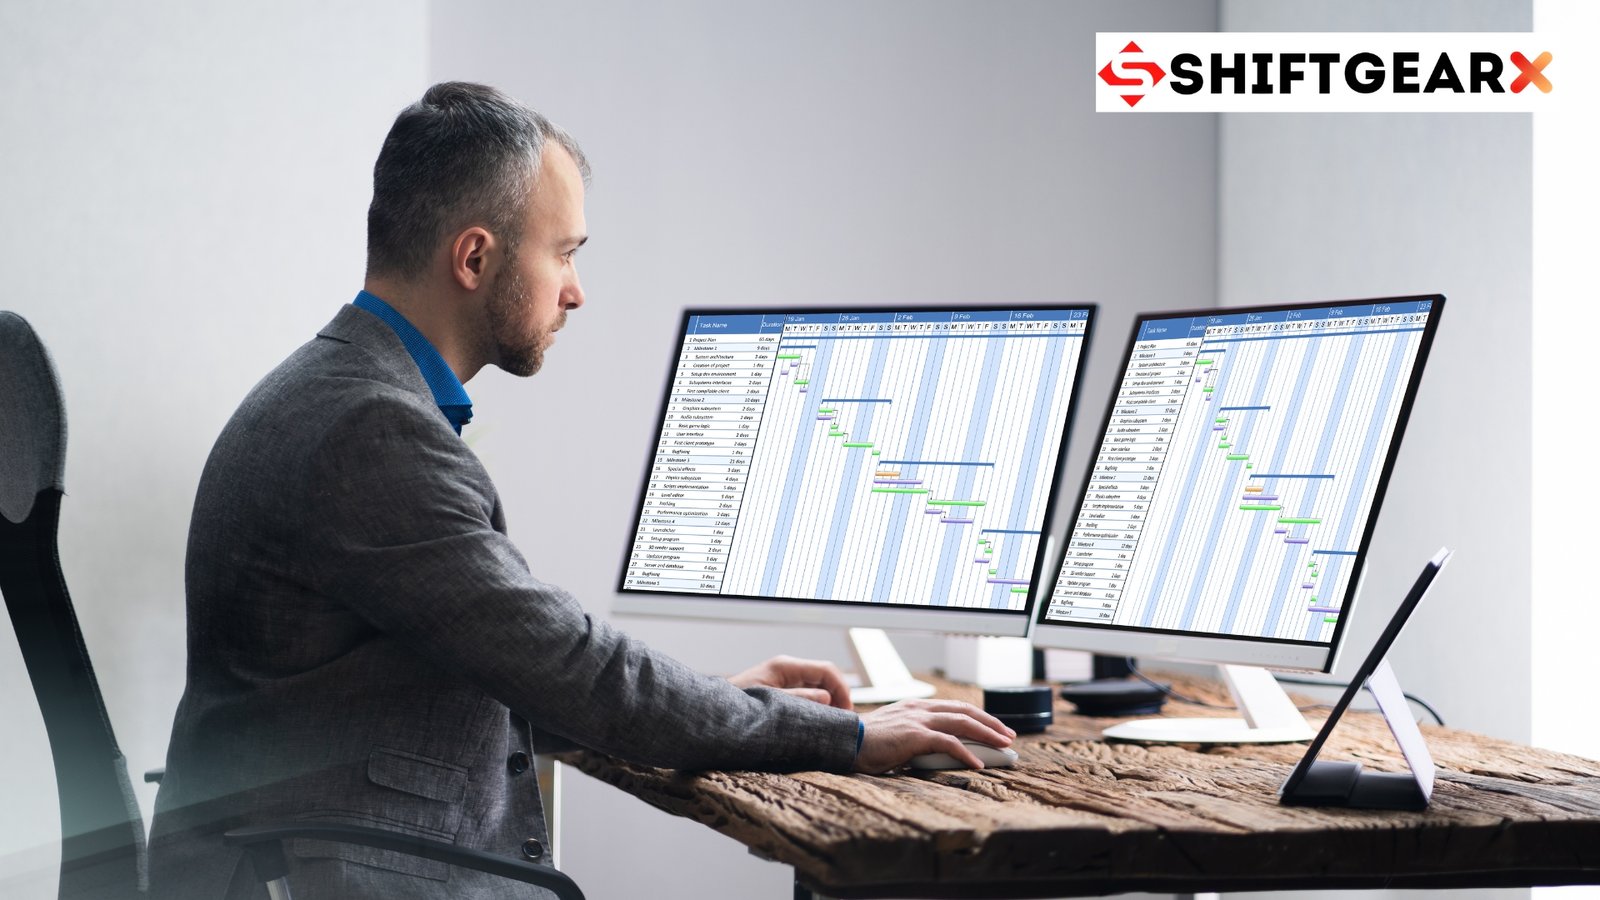
Fast forward a few years, and I found myself in charge of a much larger project. The stakes were higher, the timeline tighter, and the team spread across three different time zones.
I knew I needed a better way to manage and communicate our project timeline. That’s when I started exploring the world of interactive and dynamic Gantt charts for effective project planning.
The Problem with Traditional Gantt Charts
Before we deep dive into the world of interactive Gantt charts, let’s take a moment to consider why traditional, static Gantt charts often fall short.
-
Inflexibility: Once printed or shared, a static Gantt chart becomes outdated almost immediately. In the fast-paced world of project management, this is a significant drawback.
-
Limited Information: Static charts can only display so much information before becoming cluttered and unreadable. This often leads to oversimplification, which can be dangerous in complex projects.
-
One-Way Communication: Traditional Gantt charts are a one-way street. They convey information but don’t allow for interaction or real-time updates.
-
Accessibility Issues: Not everyone interprets visual information the same way. Static charts can be particularly challenging for team members with visual impairments or those who simply prefer different learning styles.
-
Version Control Nightmares: We’ve all been there – emailing updated versions of the project timeline, only to realize someone is working off an outdated version. It’s a recipe for confusion and mistakes.
These limitations became painfully clear to me as I juggled multiple stakeholders, shifting deadlines, and a team that needed up-to-the-minute information. I knew there had to be a better way to manage complex projects.
The Rise of Interactive and Dynamic Gantt Charts
My journey into the world of interactive Gantt charts began with a simple Google search. I was looking for a way to make our project timeline more flexible and accessible to the entire team. What I discovered was a whole new approach to project visualization and management.
Interactive and dynamic Gantt charts, often powered by advanced Gantt chart software, take the core concept of timeline visualization and supercharge it with the power of modern technology. Here’s what sets them apart:
-
Real-Time Updates: Changes to the project timeline are reflected instantly across all views. No more out-of-date printouts or confusion about the latest version.
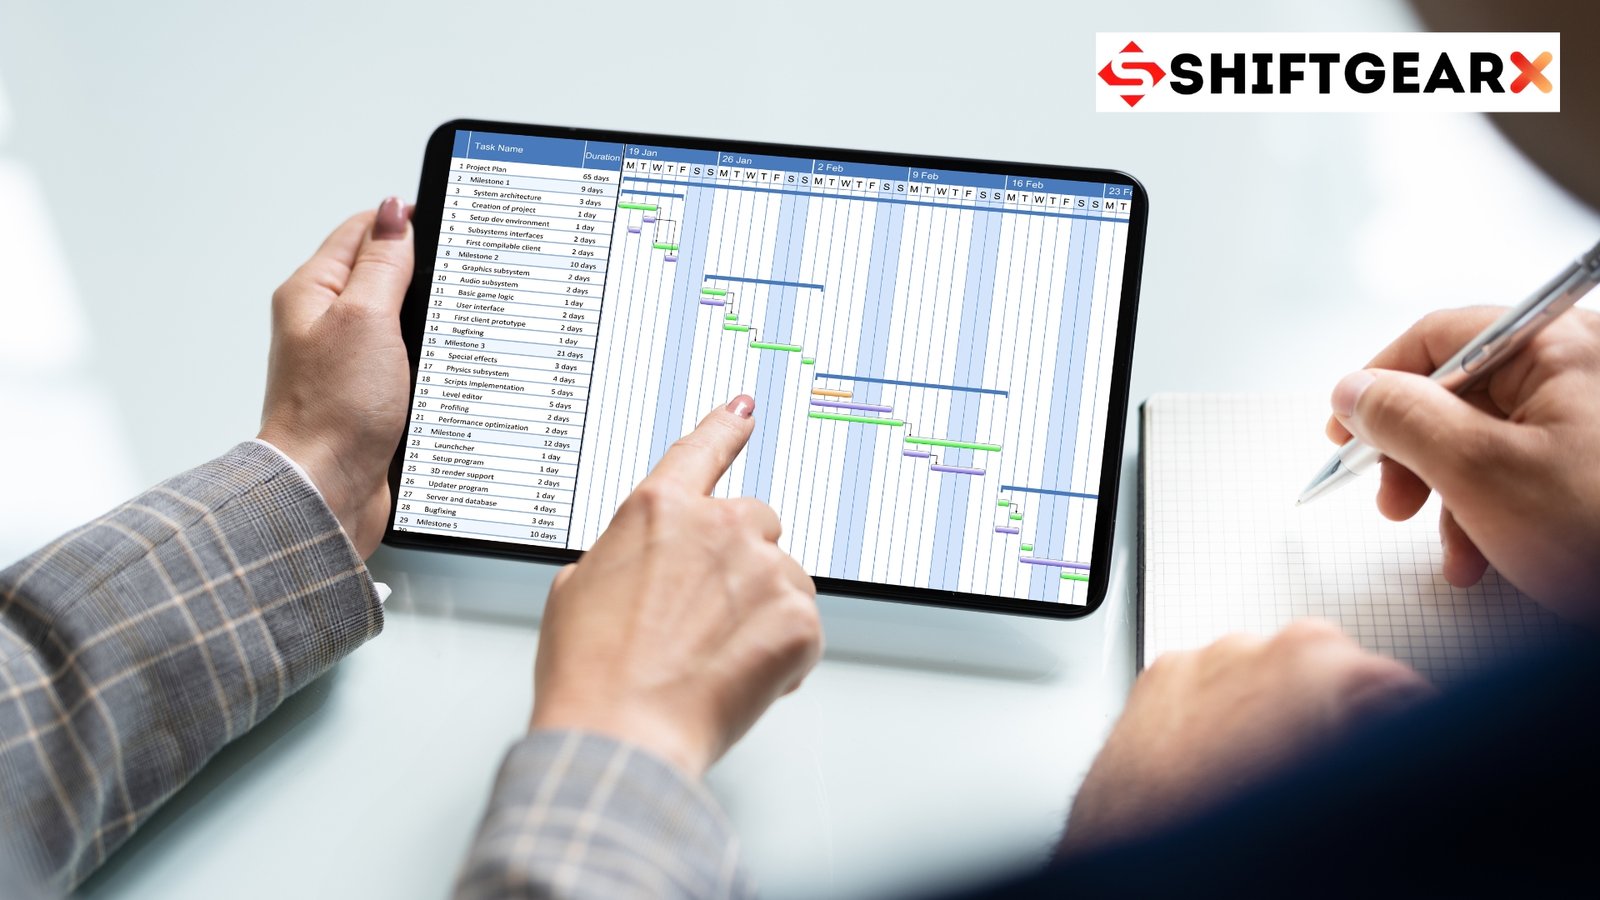
-
Drill-Down Capabilities: Users can click on tasks or milestones to reveal more detailed information, from assigned team members to specific subtasks.
-
Customizable Views: Team members can filter the chart to show only the information relevant to them, reducing cognitive overload and improving focus.
-
Integration with Other Tools: Many interactive Gantt chart solutions integrate with project management software, time tracking tools, and communication platforms, creating a more cohesive project management ecosystem.
-
Collaborative Features: Some tools allow team members to comment directly on tasks, fostering better communication and reducing the need for separate update meetings.
-
Resource Management: Advanced interactive Gantt charts often include resource allocation features, helping project managers balance workloads and identify potential bottlenecks.
-
Scenario Planning: With the ability to create and compare different timeline scenarios, project managers can make more informed decisions about resource allocation and project scheduling.
The Impact on Day-to-Day Operations
Implementing an interactive Gantt chart solution had an immediate and noticeable impact on our team’s productivity and communication. Here are some of the key benefits we experienced:
Improved Clarity and Understanding
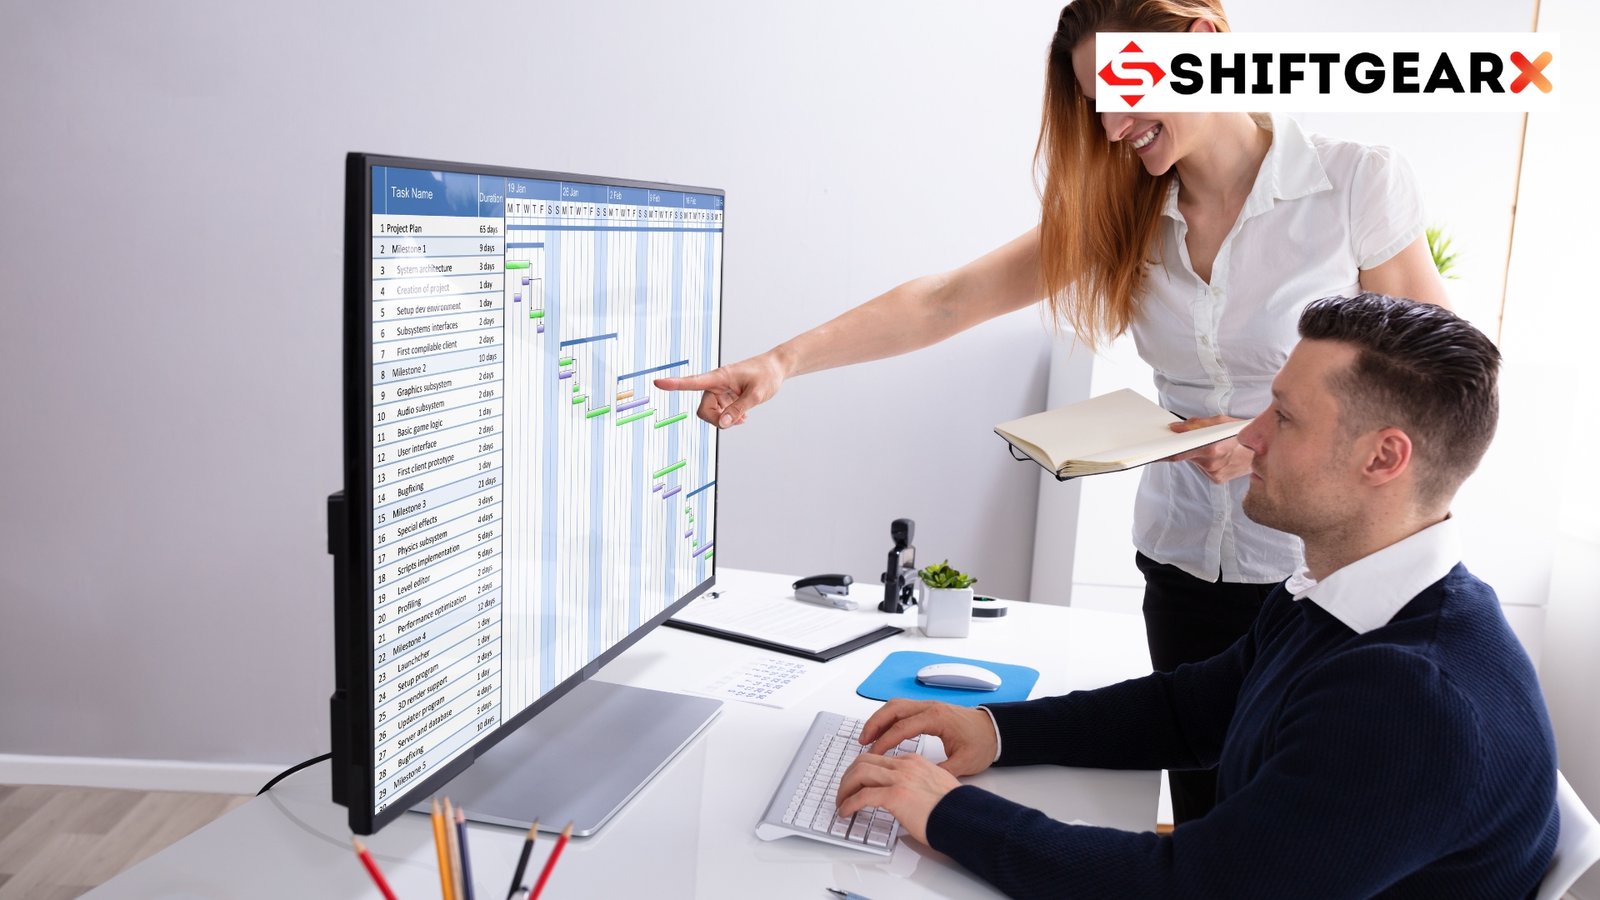
Gone were the days of squinting at tiny text on a printed chart. With the ability to zoom in, filter information, and access additional details with a click, team members reported a much clearer understanding of their roles and responsibilities within the project timeline.
One of our developers, Sarah, told me, “I used to dread project update meetings because I could never quite follow the timeline. Now, I can easily see how my tasks fit into the bigger picture, and it’s made a huge difference in how I prioritize my work.”
“The interactive Gantt chart transformed our team’s understanding of the project timeline. It’s like going from a paper map to GPS navigation – suddenly, everyone knows exactly where we are and where we’re going.” – Mark Thompson, Senior Project Manager at TechInnovate Solutions
More Efficient Meetings
Our project update meetings underwent a dramatic transformation. Instead of spending time bringing everyone up to speed on timeline changes, we could dive right into meaningful discussions about challenges and solutions.
We started using the interactive Gantt chart as a central focus during these meetings, adjusting timelines in real-time based on team input. This level of interactivity fostered a more collaborative atmosphere and led to better decision-making.
“Our meetings are now focused and productive. With the interactive Gantt chart, we can address issues in real-time, making decisions that used to take days in a matter of minutes.” – Lisa Chen, Agile Coach at Velocity Software
Proactive Problem-Solving
The ability to easily visualize task dependencies and potential bottlenecks allowed us to address issues before they became critical problems. For example, we noticed that one phase of the project was consistently falling behind schedule. By drilling down into the tasks within that phase, we identified a resource shortage that was causing the delay.
With this information, we were able to reallocate team members and adjust the timeline accordingly. In the past, this kind of insight might have come too late to make a meaningful difference.
“The predictive capabilities of our interactive Gantt chart have been a game-changer. We’ve reduced project delays by 40% since implementation, simply by being able to spot and address potential issues early.” – Dr. Amanda Patel, Director of Operations at MedTech Innovations
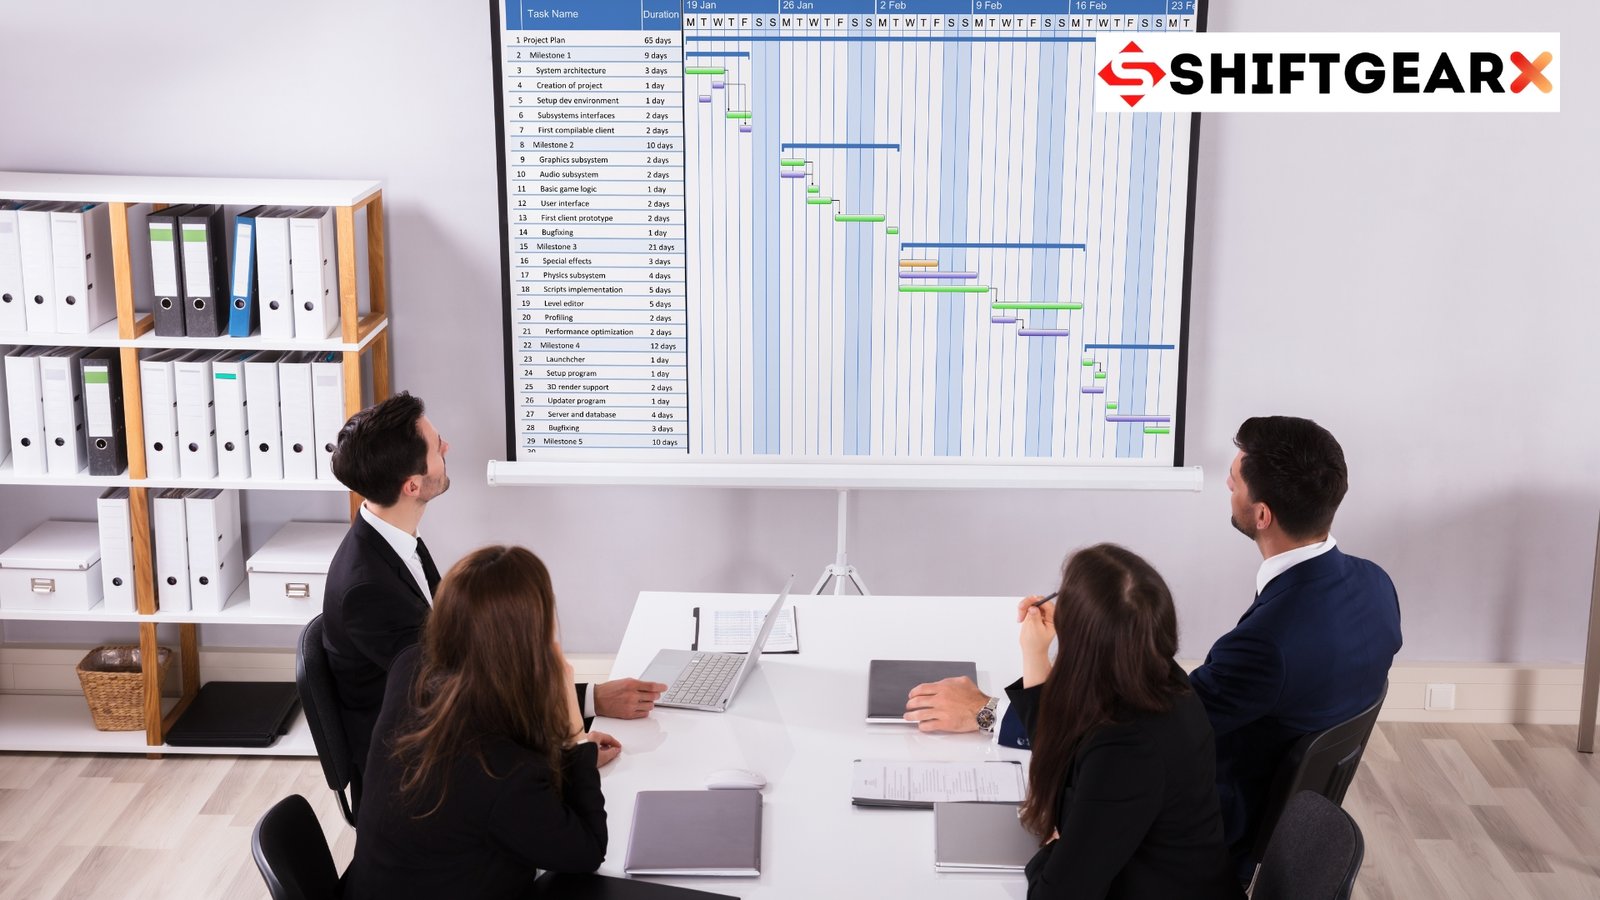
Improved Stakeholder Communication
Presenting project updates to stakeholders became a much smoother process. Instead of static slides or dense spreadsheets, we could walk them through an interactive timeline, adjusting the view to focus on the aspects most relevant to their interests.
This level of transparency and interactivity went a long way in building trust and managing expectations. One of our key stakeholders commented, “For the first time, I feel like I have a real handle on where the project stands and where it’s headed.”
“As an external stakeholder, the interactive Gantt chart has given me unprecedented visibility into project progress. It’s built a new level of trust and collaboration with our vendors.” – Robert Kang, Chief Procurement Officer at Global Retail Corp
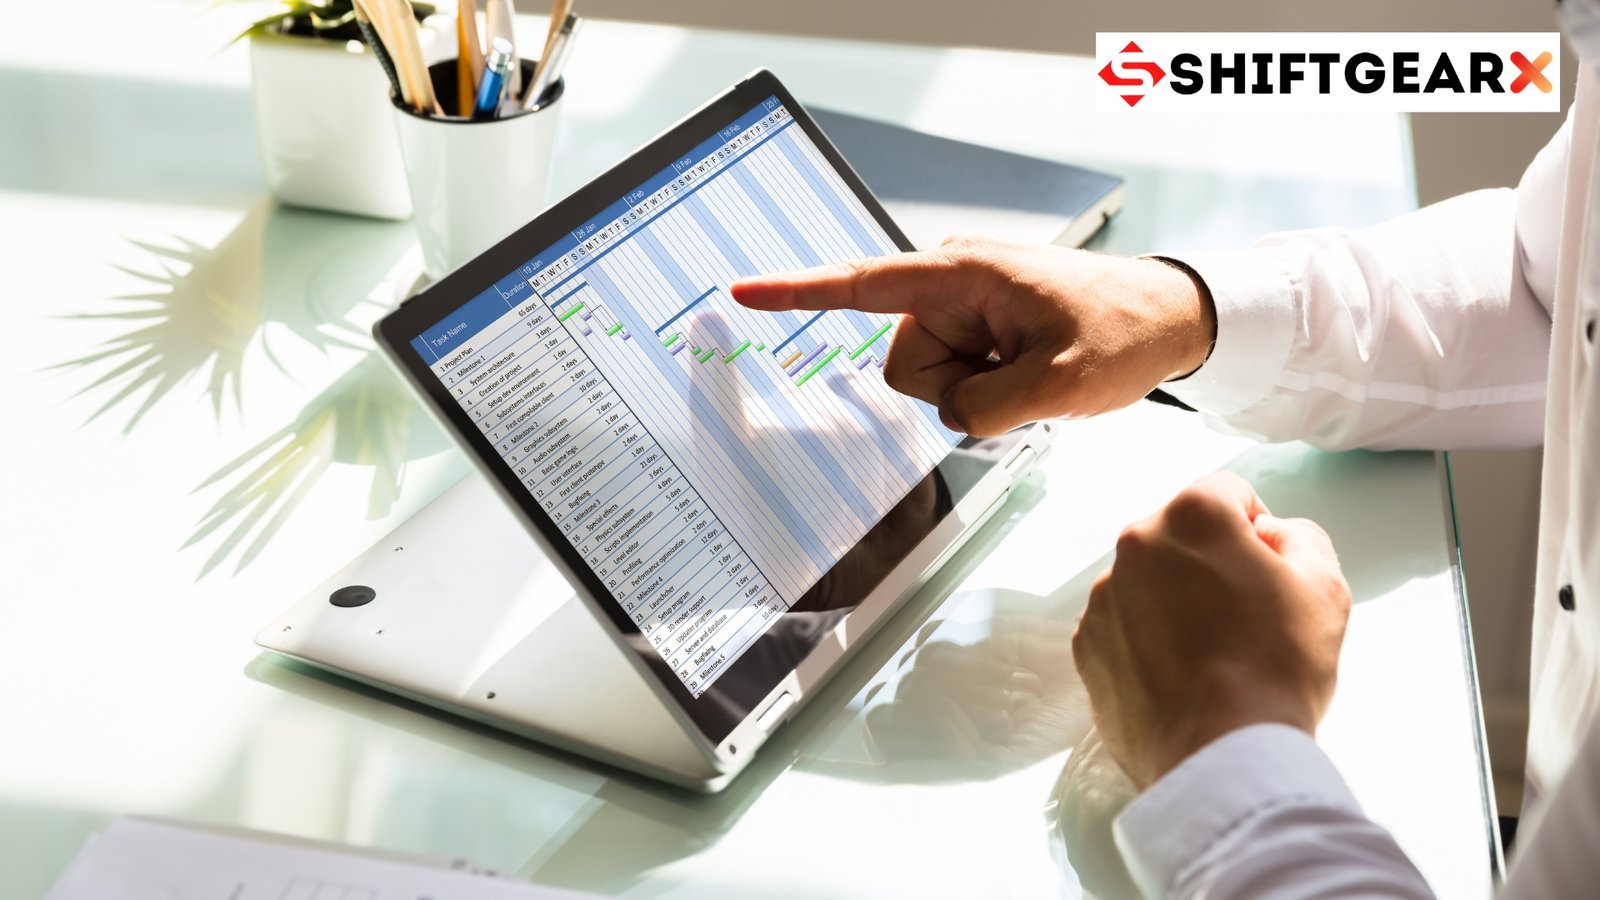
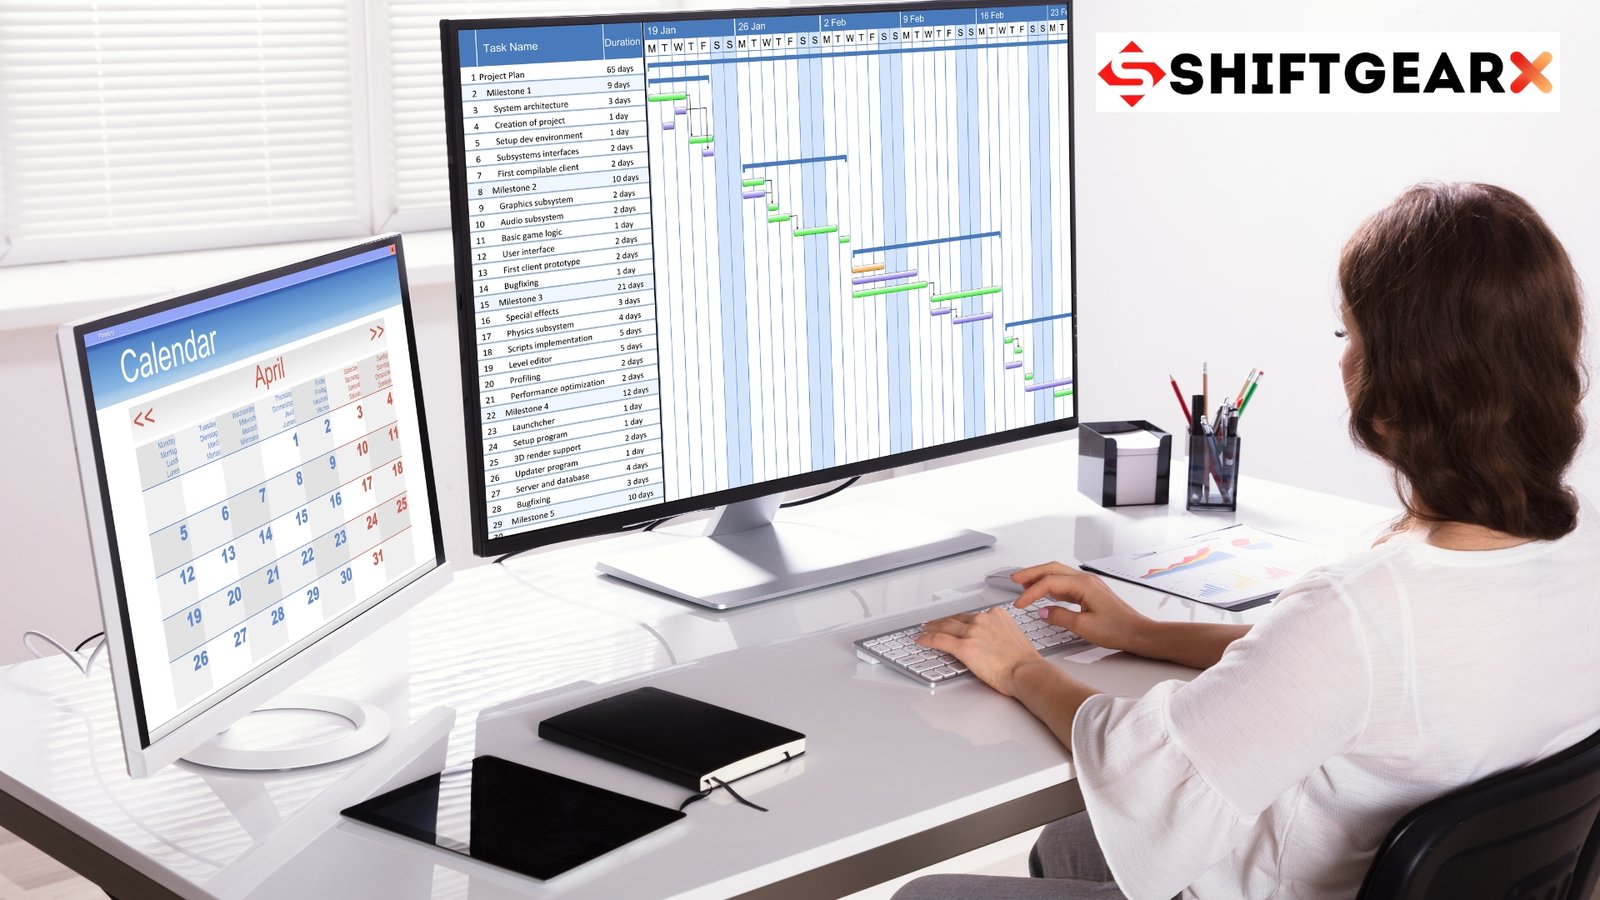
Enhanced Remote Collaboration
As our team became more distributed, the interactive Gantt chart proved invaluable in keeping everyone aligned. Team members in different time zones could access the most up-to-date project information at any time, reducing confusion and minimizing the need for constant update emails.
The ability to comment directly on tasks within the Gantt chart also improved asynchronous communication, allowing team members to provide updates and ask questions without scheduling additional meetings.
“Managing a team across three continents became significantly easier with our interactive Gantt chart. It’s like having a 24/7 project command center that everyone can access.” – Maria Gonzalez, Global Project Director at MultiNational Consulting Group
Challenges and Considerations of Task Dependencies
While the move to interactive Gantt charts brought numerous benefits, it wasn’t without its challenges. Here are a few things to keep in mind if you’re considering making the switch:
-
Learning Curve: Some team members, particularly those less comfortable with technology, may need time and training to fully embrace the new system.
-
Tool Selection: With numerous options on the market, choosing the right interactive Gantt chart solution for your team’s needs can be overwhelming. It’s important to carefully evaluate features, integrations, and user experience before making a decision. Additionally, consider the limitations of Gantt charts and how other project management tools might complement or enhance your workflow.
-
Data Security: As with any cloud-based solution, it’s crucial to consider data security and privacy, especially when dealing with sensitive project information.
-
Overreliance on Technology: While interactive tools can greatly enhance project management, they shouldn’t replace critical thinking and human judgment. It’s important to maintain a balance between leveraging technology and relying on experience and intuition.
-
Cost Considerations: Many advanced interactive Gantt chart solutions come with a significant price tag, especially for larger teams. It’s important to weigh the cost against the potential benefits and productivity gains.
Looking to the Future
As I reflect on our journey from static to interactive Gantt charts, I’m excited about the future of project visualization and management. Emerging technologies like artificial intelligence and machine learning are already being integrated into some Gantt chart solutions, offering predictive analytics and even more sophisticated planning capabilities throughout the project lifecycle.
For example, some tools are now using historical project data to suggest more accurate timelines or flag potential risks based on past project performance. Others are experimenting with voice commands and natural language processing to make interaction with Gantt charts even more intuitive.
While these advancements are exciting, I believe the core value of interactive Gantt charts lies in their ability to foster better communication, increase transparency, and empower teams to work more efficiently. As the technology continues to evolve, I expect we’ll see even more emphasis on collaboration features and integration with other business tools.
Is an Interactive Gantt Chart Right for Your Team?
If you’re still relying on static Gantt charts or struggling with project visualization, it might be time to explore the world of interactive and dynamic Gantt charts. Here are a few questions to consider:
-
Do you find yourself constantly updating and re-sharing project timelines?
-
Is your team struggling to understand how their individual tasks fit into the bigger picture?
-
Are you managing a complex project with numerous dependencies and resource constraints?
-
Do you have team members working remotely or in different time zones?
-
Are your stakeholders asking for more detailed or up-to-date project information?
If you answered yes to any of these questions, an interactive Gantt chart solution could make a significant difference in your project management process, ultimately contributing to project success.
Remember, the goal isn’t to adopt new technology for its own sake, but to find tools that genuinely improve your team’s ability to work effectively and deliver results. Take the time to research different options, involve your team in the decision-making process, and be prepared for a period of adjustment as you implement a new system.
Top Project Management Software for Interactive and Dynamic Gantt Charts
As the demand for more flexible and interactive project management tools has grown, so too has the number of free gantt chart software solutions offering dynamic Gantt chart capabilities. While there are many options on the market, I’ve had personal experience with three tools that stand out for their robust features and user-friendly interfaces. Let’s take a closer look at each:
1. Microsoft Project
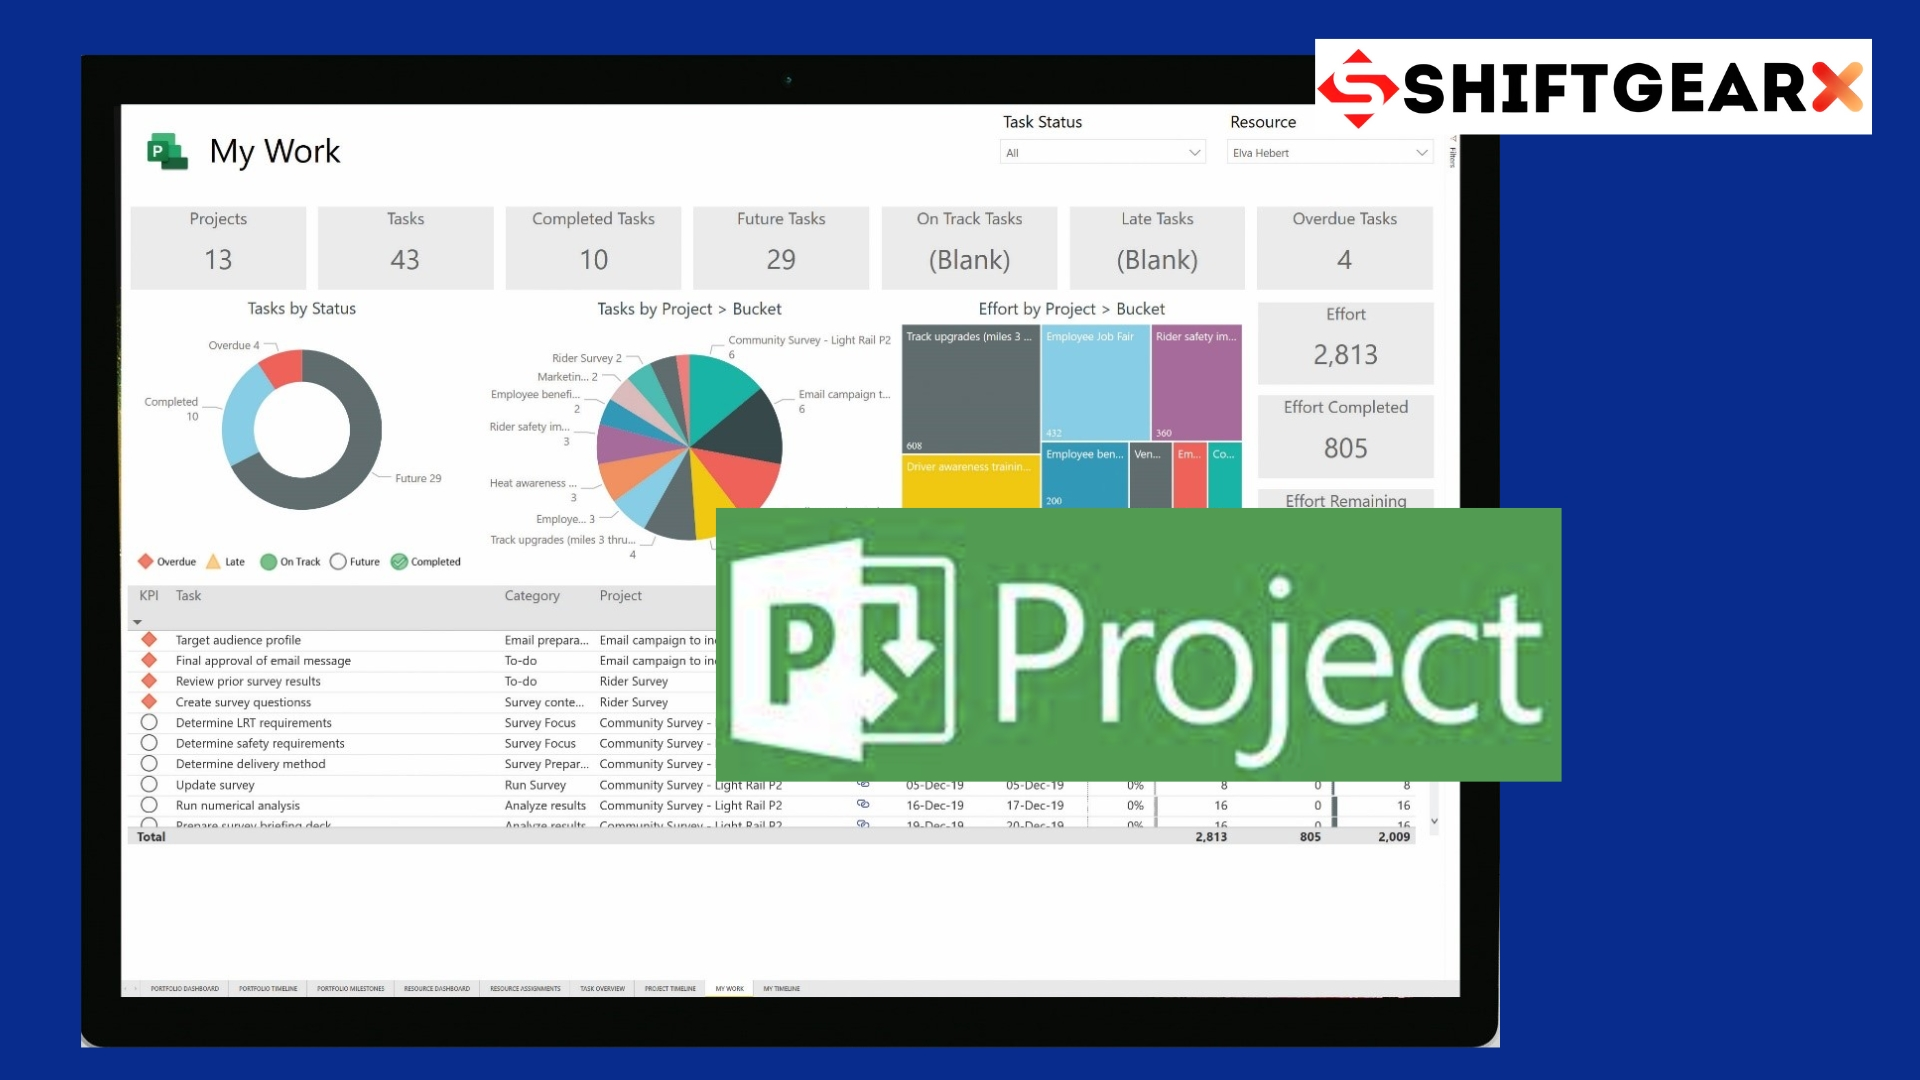
Microsoft Project has been a staple in the project management world for decades, and for good reason. Its latest versions have made significant strides in interactivity and dynamic features.
Key Features:
· Seamless integration with other Microsoft Office tools
· Resource management and capacity planning
· Multiple baselines for tracking changes over time
· Customizable views and reports
· Cloud-based collaboration through Microsoft 365
My Experience: I’ve used Microsoft Project in enterprise environments where integration with existing Microsoft tools was crucial. Enabling project managers to efficiently oversee multiple resources and optimize project workflows, its learning curve can be steep, but the power and flexibility it offers are unmatched for complex, large-scale projects.
One project manager I worked with, Tom, shared his thoughts: “Microsoft Project’s ability to handle intricate dependencies and resource allocations saved our team countless hours. The dynamic nature of the Gantt charts meant we could adjust on the fly during stakeholder meetings, which was a huge win for us.”
Best For: Large enterprises, complex projects with multiple dependencies, teams already invested in the Microsoft ecosystem.
2. TeamGantt
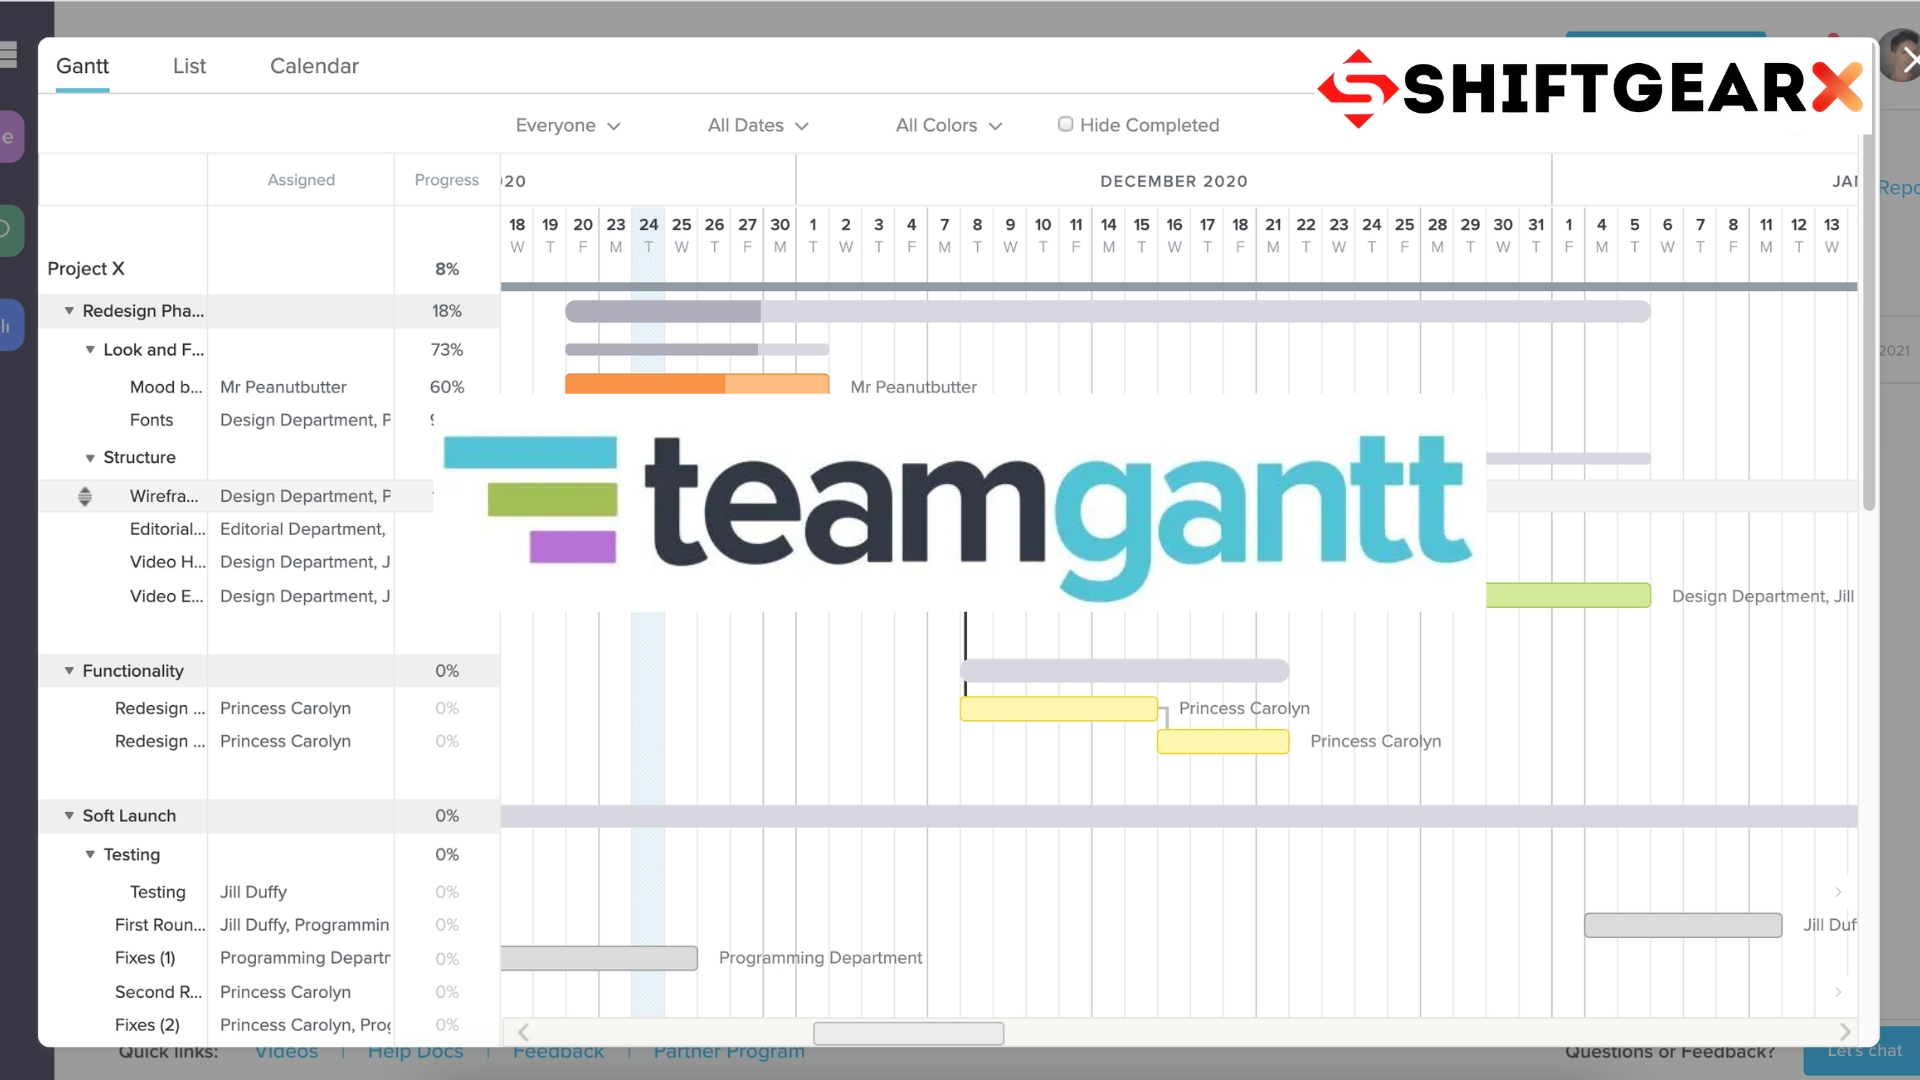
TeamGantt takes a more modern, web-based approach to Gantt charts. Its clean interface and collaborative features make it a favorite among teams of all sizes.
Key Features:
· Intuitive drag-and-drop interface with customizable gantt chart templates
· Real-time collaboration and commenting
· Workload management view
· Time tracking integration
· Mobile app for on-the-go updates
My Experience: I introduced TeamGantt to a startup I was consulting for, and the team took to it immediately. The low barrier to entry meant even team members who were skeptical of project management tools became active users.
Sarah, a UX designer on the team, noted: “TeamGantt made our design sprints so much more organized. Being able to quickly shift tasks around as priorities changed kept our projects on track, even when client demands were unpredictable.”
Best For: Small to medium-sized teams, creative agencies, organizations looking for a low-friction introduction to Gantt charts.
3. Smartsheet
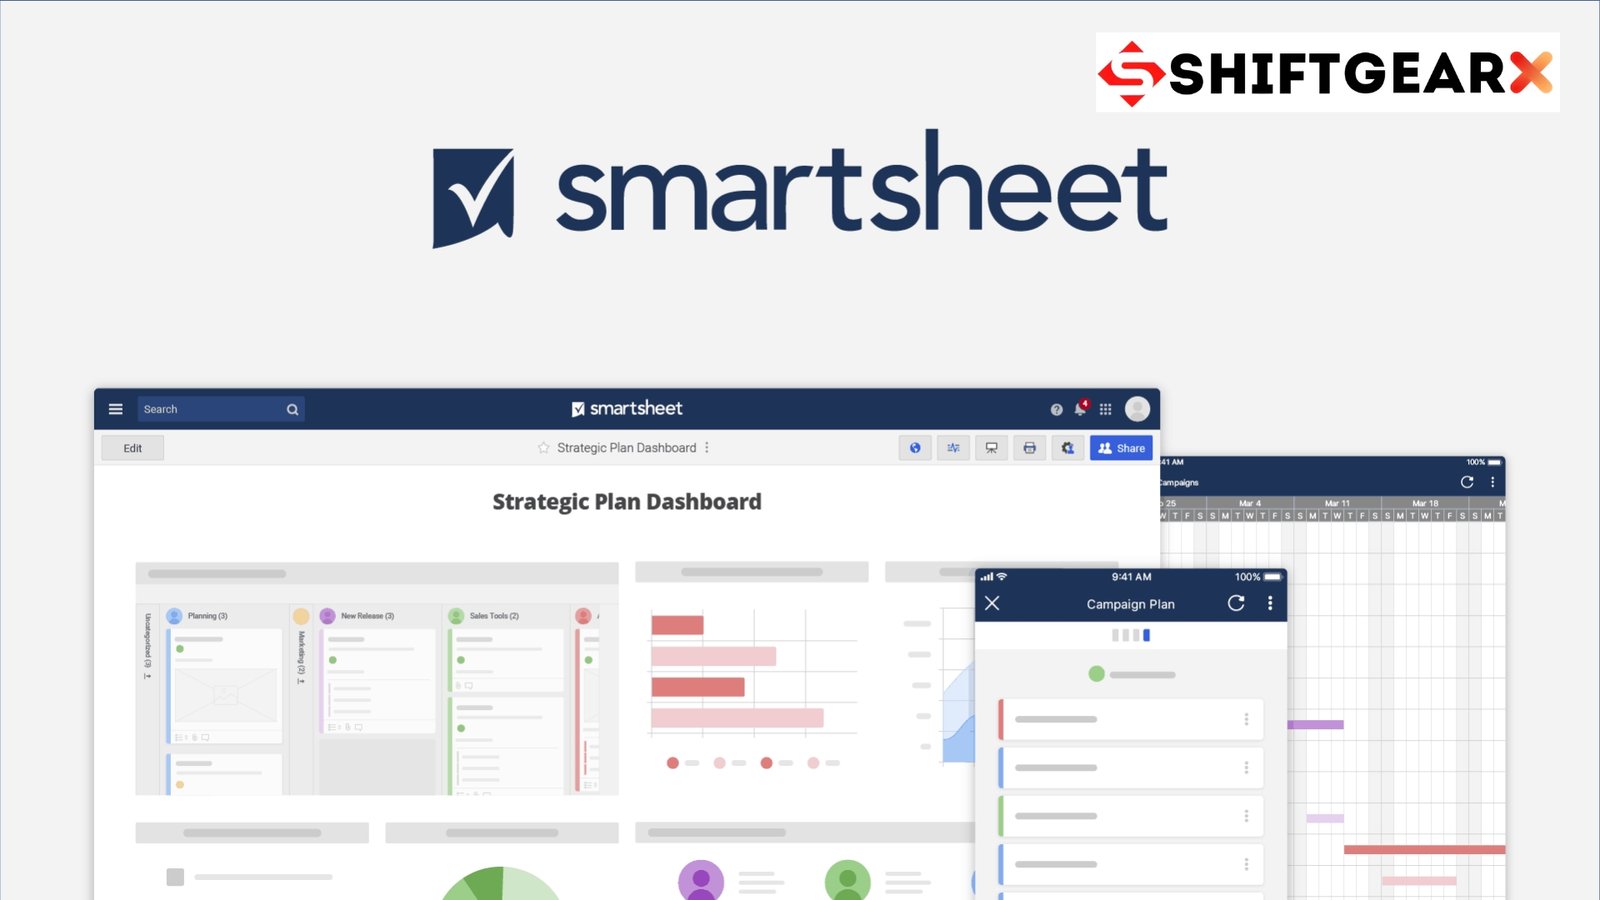
Smartsheet combines the familiarity of spreadsheets with the visual power of Gantt charts, creating a unique and versatile project management tool.
Key Features:
· Spreadsheet-like interface for easy data entry
· Automated workflows and approvals
· Robust reporting and dashboards
· Integrations with many popular business tools
· Collaborative proofing and markup tools
My Experience: I’ve seen Smartsheet shine in cross-functional projects where different team members preferred different views of the same data. The flexibility to switch between spreadsheet, Gantt, and card views was a game-changer for team adoption.
A marketing director I worked with, Lisa, shared: “Smartsheet revolutionized how we manage our campaign timelines. The ability to create roll-up reports across multiple projects gives our executives the high-level view they need, while individual team members can dive into the details of their specific tasks.”
Best For: Teams that work heavily with data, organizations that need flexible viewing options, projects that require extensive reporting and analytics.

Choosing the Right Tool
While these three tools are excellent options, the “right” choice depends entirely on your team’s specific needs, technical capabilities, and project complexities. It is crucial to consider how well the tool supports the entire project lifecycle, ensuring effective communication, task monitoring, and updates. Here are a few factors to consider when making your decision:
-
Ease of Use: How tech-savvy is your team? Will they need extensive training?
-
Integration: What other tools does the Gantt chart solution need to work with?
-
Scalability: Can the tool grow with your organization?
-
Cost: What’s your budget, and does the pricing model (per user, per project, etc.) align with your needs?
-
Support: What kind of customer support and resources are available?
Remember, the goal is to find a tool that enhances your team’s productivity, not one that becomes an additional hurdle. Many of these platforms offer free trials, so don’t hesitate to test drive a few before making a commitment.
To me, the success of any project management tool, including interactive Gantt charts, depends as much on team buy-in and proper implementation as it does on the features of the tool itself. Take the time to involve key team members in the decision-making process, and plan for a thorough onboarding to ensure everyone is comfortable with the new system.
With the right interactive Gantt chart tool in place, you’ll be well on your way to more transparent, efficient, and successful project management.
In Summary
In my experience, the effort is well worth it. The clarity, flexibility, and collaborative power of interactive Gantt charts have transformed how we manage projects, communicate with stakeholders, and ultimately deliver value to our clients.
If you’re ready to take your project management to the next level, I encourage you to explore the world of interactive and dynamic Gantt charts. Your future self – and your team – will thank you.
Subscribe to Shift Gearx for more!

The Guide to a Smooth…

Fanfix Payment Methods to Make…

Achieve Next-Gen Call Centre Customer…
Also Read: Project Management Software Success. Best Kept Secret! – Tech News Before It’s News | Shift GearX
You will also love: 18 ERP System Examples [2024 Guide] – Tech News Before It’s News | Shift GearX


